Sitecore Managed Cloud Services (MCS) PaaS offers a robust and scalable platform for hosting Sitecore solutions. A critical aspect of maintaining and troubleshooting any application, especially in a PaaS environment, is effective log management. Sitecore MCS leverages the power of Azure Application Insights to provide a centralized and comprehensive logging solution. This post will explore how different Sitecore roles pipe their logs to Application Insights and how developers can query these ingested logs using Kusto Query Language (KQL) via the Azure portal.
Sitecore Roles and Log Ingestion in Application Insights
In a Sitecore MCS PaaS setup, various Sitecore roles (Content Delivery, Content Management, Processing, Reporting, xDB Collection/Search, etc.) are configured to send telemetry data, including logs, to a dedicated Azure Application Insights instance. This is typically achieved through a combination of:
- Application Insights SDK: Sitecore applications are instrumented with the Application Insights SDK. This SDK automatically collects various telemetry types, such as requests, exceptions, dependencies, and traces (which include log messages).
- Sitecore Configuration: Sitecore’s logging framework (often an abstraction over log4net or Serilog) is configured to use an Application Insights appender or sink. This ensures that logs written using Sitecore’s standard logging APIs (
Sitecore.Diagnostics.Log) are routed to Application Insights.
Each Sitecore role instance runs as a separate component within the Azure App Service or Virtual Machine Scale Set. Application Insights can distinguish logs from different roles using properties like cloud_RoleName (often automatically populated with the App Service name) or custom properties configured during deployment.
This setup provides a unified view of logs across your entire Sitecore landscape, making it easier to correlate events and diagnose issues that span multiple roles.
Accessing Logs in Azure Application Insights
To access the logs for your Sitecore MCS environment:
- Navigate to the Azure Portal: Log in to portal.azure.com.
- Find your Application Insights Resource: Locate the Application Insights resource associated with your Sitecore MCS environment. This is usually provisioned as part of your MCS setup.
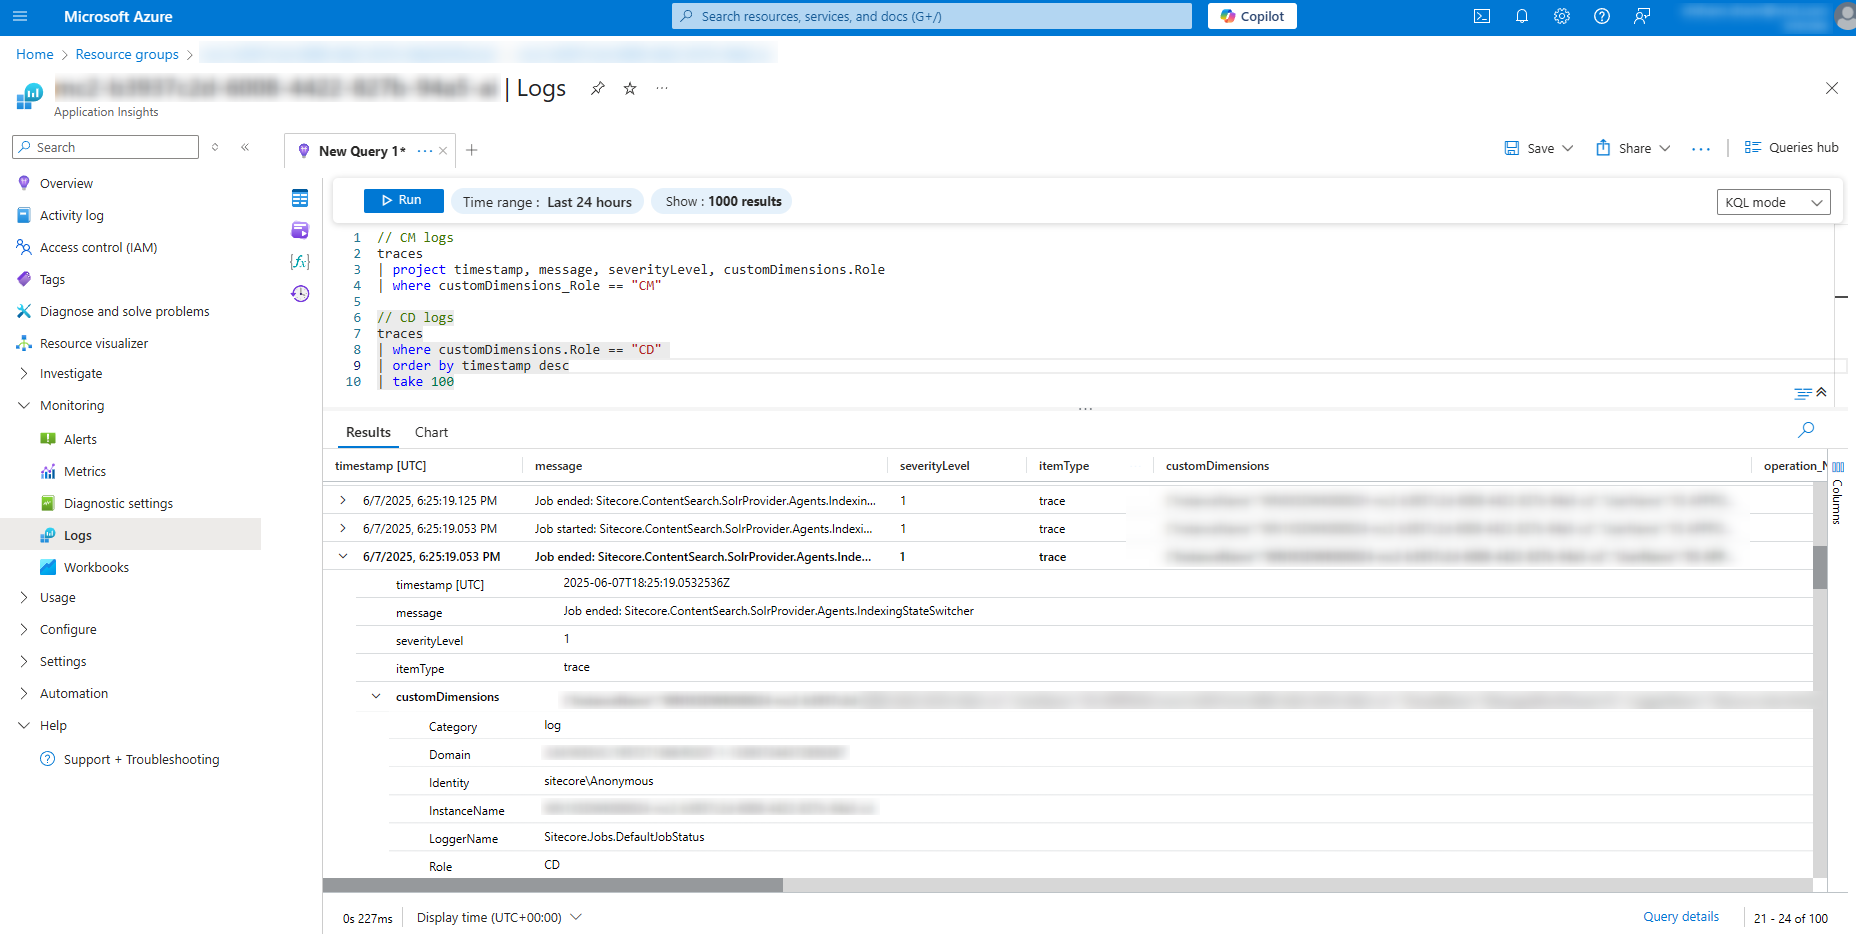
- Open Logs (Log Analytics): In the Application Insights resource menu, under the “Monitoring” section, click on “Logs”. This will open the Log Analytics query interface.
Querying Logs with Kusto Query Language (KQL)
Kusto Query Language (KQL) is a powerful read-only query language used to analyze data in Azure Application Insights, Azure Monitor Logs, and other Azure data services. Here are some common KQL queries you can use to explore your Sitecore logs:
1. View All Traces (Logs)
This is the most basic query to see all log messages (traces) sent to Application Insights.
// Show all trace messages
traces
| order by timestamp desc
| take 100 // Limit to the latest 100 for performance
traces: Specifies the table containing log messages.order by timestamp desc: Sorts the results by timestamp, newest first.take 100: Limits the output to the first 100 records.
2. Filter by Sitecore Role Instance
Sitecore MCS Application Insights setup uses customDimensions.Role or a similar custom property to identify Sitecore roles (e.g: CM, CD):
// Show logs from a specific Content Management (CM) instance
traces
| where customDimensions.Role == "CM" // this is the default identifier with vanila mcs setup
| order by timestamp desc
| take 100
customDimensions.Role: This field often holds the name of the Azure App Service instance. You might need to inspect your logs to find the exact property name used (e.g.,customDimensions.RoleorcustomDimensions.InstanceName).
If roles are distinguished by customDimensions.Role:
// Show logs from all Content Delivery (CD) roles
traces
| where customDimensions.Role contains "CD"  // this is the default identifier with vanila mcs setup
| order by timestamp desc
| take 100
3. Filter by Severity Level
Application Insights maps standard log levels (Information, Warning, Error, Critical/Fatal) to a severityLevel property.
// Show all Error and Critical logs
traces
| where severityLevel >= 3 // 0:Verbose, 1:Information, 2:Warning, 3:Error, 4:Critical
| order by timestamp desc
| take 100
4. Search for Specific Messages or Keywords
Use the search operator or contains for keyword searching within the log message.
// Find logs containing a specific error message or keyword
traces
| where message contains "NullReferenceException" or message has "specific error code"
| order by timestamp desc
| take 50
For a broader search across multiple columns (more resource-intensive):
// Search for 'NullReferenceException' across all columns in the traces table
search in (traces) "NullReferenceException"
| take 50
5. Tracking Exceptions
Application Insights has a dedicated exceptions table for unhandled and handled exceptions.
// Show the latest 50 exceptions
exceptions
| order by timestamp desc
| take 50
To see details of a specific exception type:
// Show details for a specific type of exception
exceptions
| where type == "System.NullReferenceException"
| order by timestamp desc
| project timestamp, type, outerMessage, innermostMessage, problemId, cloud_RoleInstance, customDimensions
project: Selects specific columns to display, making the output cleaner.
6. Analyzing Performance (Requests Table)
While not strictly logs, the requests table is invaluable for understanding performance issues, which often correlate with errors found in logs.
// Show requests that took longer than 5 seconds
requests
| where duration > 5000 // Duration is in milliseconds
| order by duration desc
| take 50
| project timestamp, name, url, duration, resultCode, success, cloud_RoleInstance
7. Correlating Logs with Requests
If you have an operation_Id, you can correlate traces, exceptions, and requests related to a single operation.
// Find all telemetry for a specific operation ID (e.g., from an error message or a slow request)
let specific_operation_Id = "YOUR_OPERATION_ID"; // Replace with an actual operation_Id
union traces, requests, exceptions
| where operation_Id == specific_operation_Id
| order by timestamp asc
Best Practices for Querying
- Be Specific: Start with broad queries and then narrow them down using
whereclauses. - Time Range: Use the time range picker in the Log Analytics UI to limit your search window. This significantly improves query performance.
takeorlimit: Always usetake(orlimit) during exploration to avoid pulling massive datasets.project: Select only the columns you need to make results easier to read and improve performance.- Custom Dimensions: Leverage any custom dimensions your Sitecore solution might be logging. These can be powerful for filtering (e.g.,
customDimensions.Category,customDimensions.Identity,customDimensions.LoggerName).
Conclusion
Azure Application Insights provides a powerful, centralized logging solution for Sitecore MCS PaaS environments. By understanding how Sitecore roles pipe their data and mastering KQL, developers and administrators can efficiently troubleshoot issues, monitor application health, and gain valuable insights into their Sitecore instances. The ability to query and correlate logs across different roles and telemetry types is invaluable for maintaining a stable and performant Sitecore platform in the cloud.
Start exploring your Sitecore logs in Application Insights today and unlock the power of KQL!